How Phoenix logs endpoint requests and responses
February 14, 2024I recently had the opportunity to look into this issue in the Phoenix framework repository. While trying to understand how to solve the issue, I ended up learning how Phoenix logs information about incoming requests and returned responses, it’s actually more interesting than I originally thought and it involves using both an Erlang package called telemetry as well as Plug.Telemetry.
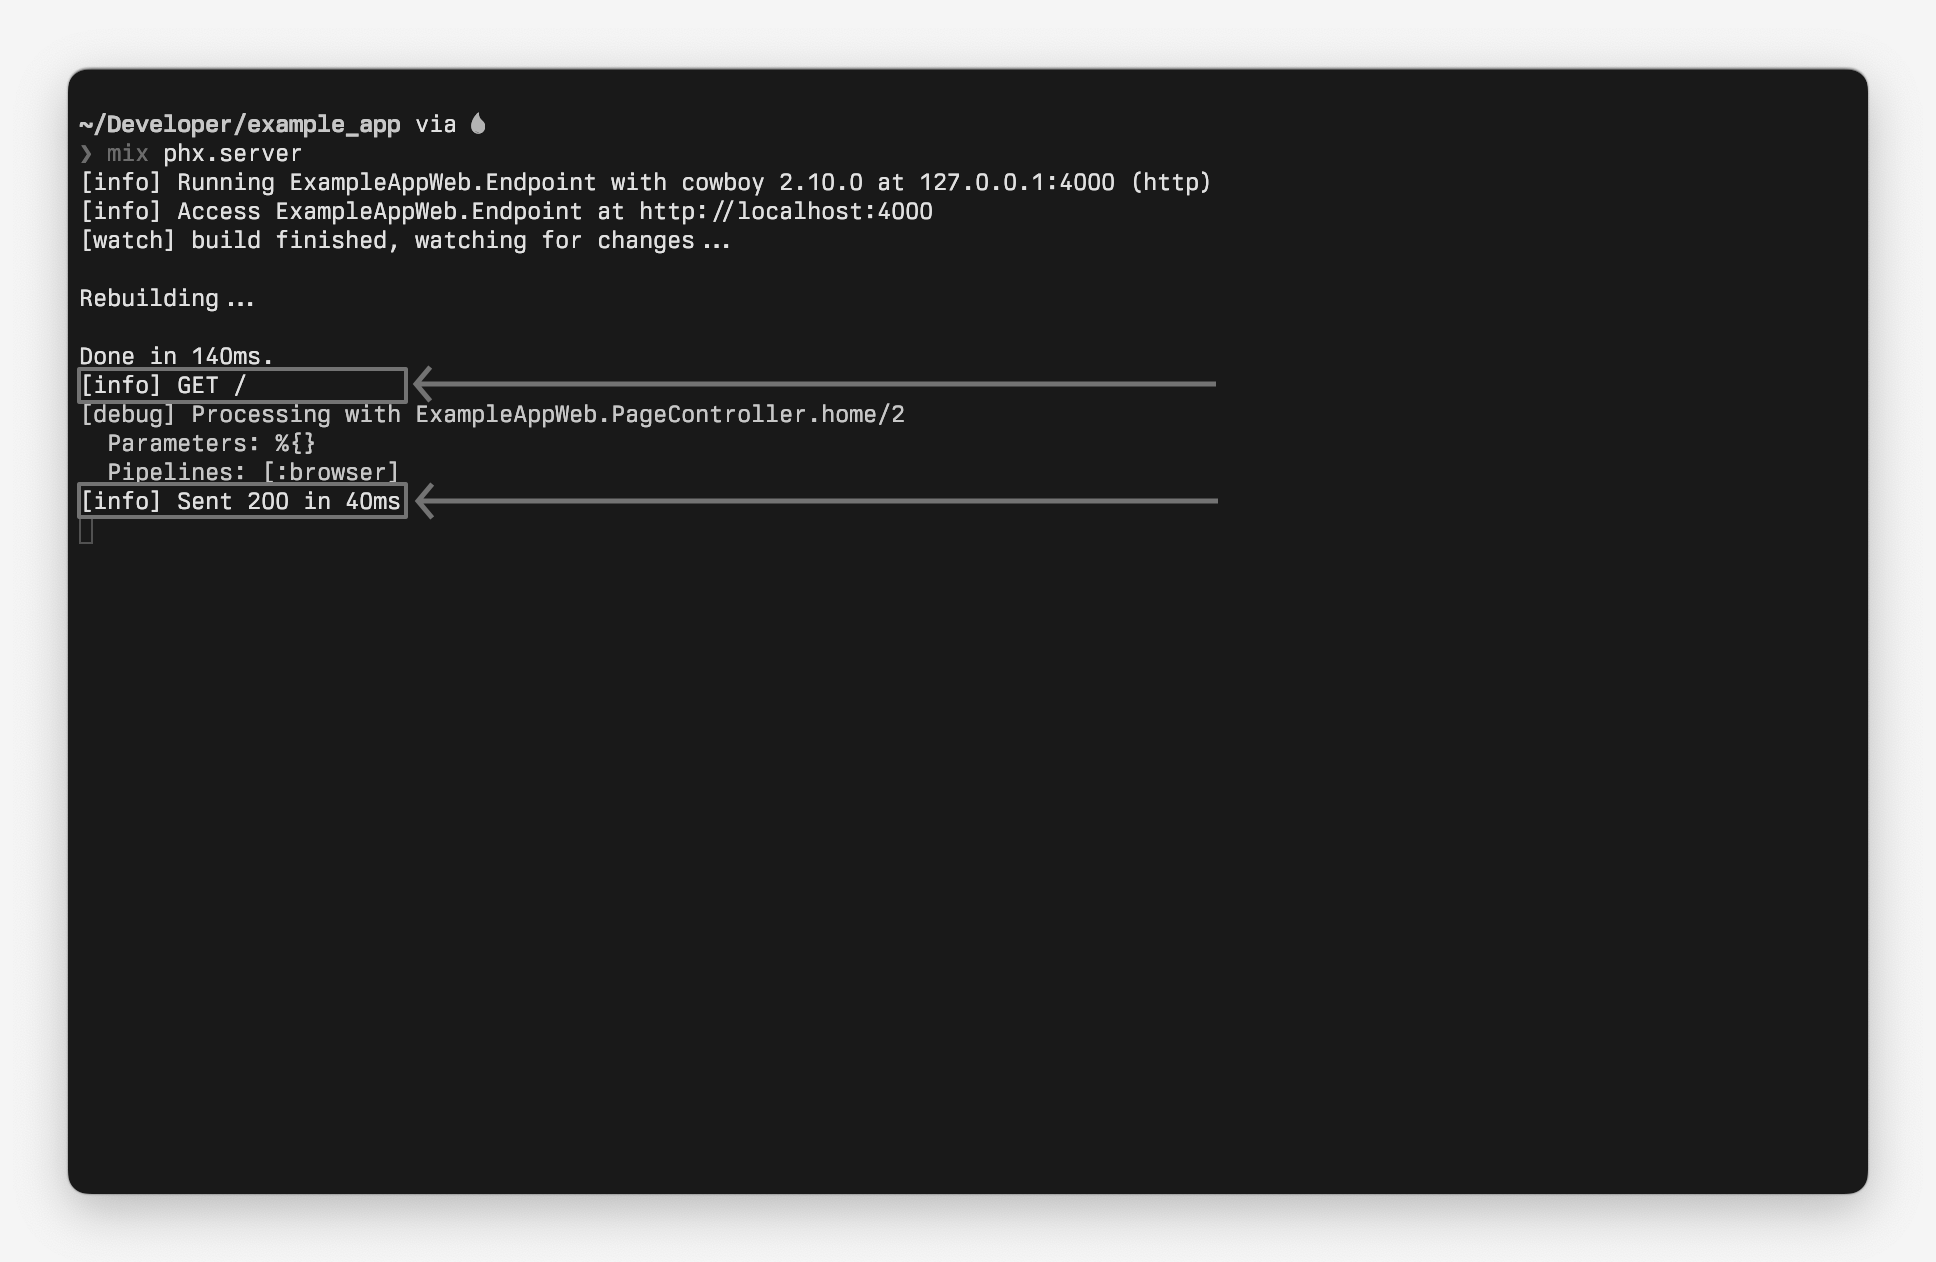
This blog post does not delve into all of the logging done by Phoenix, focusing
solely on both the [info] messages logged when a new request starts being
processed and before a response is returned, as outlined below:
We’ll look at each step separately, while providing code snippets to follow along, if you wish to test it out yourself.
Telemetry
As stated in telemetry’s README:
“Telemetry is a lightweight library for dynamic dispatching of events, with a focus on metrics and instrumentation. Any Erlang or Elixir library can use telemetry to emit events. Application code and other libraries can then hook into those events and run custom handlers.”
For the context of this blogpost, it’s only important to know the two following functions in telemetry:
- :telemetry.attach/4 - attaches an handler to an event, allowing the caller to define a function to be called when that specific event is emitted.
- The handler function to be called must have a signature of handler_function().
- :telemetry.execute/2 - emits an event, invoking all handlers attached to this event, while passing measurements to the handler function.
- The :telemetry.execute/3 function is also available if you wish to also provide metadata to the handler function attached to the event.
Let’s try it ourselves! Open an IEx shell and follow the steps below:
- Call
:telemetry.attach/4, providing whatever handler ID you wish, as well as the event’s name:
:telemetry.attach(
	:handler_a,
	[:my_event],
	fn _event_name, measurements, _metadata, _config ->
		IO.puts("The event was emitted!")
		IO.puts("Measurements: #{inspect(measurements)}")
	end,
	[])
- Call
:telemetry.execute/2with the same event name used in the call to:telemetry.attach/4, together with some measurements (map()) or a value (number()).
:telemetry.execute([:my_event], %{duration: 10})
If you're following along you should see the two messages defined in the first step being outputed to the console.
As noted in Telemetry’s documentation for attach/4 providing anonymous functions should be avoided, due to performance reasons, an anonymous function was used merely for demonstration purposes.
Note: You can retrieve a list of handlers attached to a specific event using
:telemetry.list_handlers/1.
Plug.Telemetry
Now that we’re familiar with both :telemetry.attach/4 and
:telemetry.execute/2 we can start to comprehend how Plug.Telemetry comes
into play.
When using this plug, callers are required to provide the :event_prefix
option. This option’s value will be used as the prefix for two distinct
events. Imagine that the plug is configured in the following way:
plug Plug.Telemetry, event_prefix: [:user, :invitation]
This plug will emit two distinct events:
- When this plug is called it will first emit an event using
:telemetry.executewith event identifier set toevent_prefix ++ [:start]– in this case[:user, :invitation, :start]. - It also leverages
Plug.Conn.register_before_send/2to schedule a call:telemetry.execute/3with event identifier set toevent_prefix ++ [:stop]– in this case[:user, :invitation, :stop].
In short, this plug emits start and stop events using the provided
:event_prefix, when the plug is called and just before a response is
returned, respectively.
Here’s a quick snippet leveraging both :telemetry and Plug.Telemetry to
show the event handler being called twice, once for each event.
# 1. Define start and stop events.
start_event = [:user, :invitation, :start]
stop_event = [:user, :invitation, :stop]

# 2. Attach handler to both start and stop events.
:telemetry.attach(
  :start_handler,
  start_event,
  fn _, _, _, _ -> IO.puts("Started user invitation") end,
  :ok)
:telemetry.attach(
  :stop_handler,
  stop_event,
  fn _, _, _, _ -> IO.puts("Finished user invitation") end,
  :ok)

# 3. Build the connection and call Plug.Telemetry, which will invoke the
# event handler for the start event.
conn = Phoenix.ConnTest.build_conn()
conn = Plug.Telemetry.call(conn, {start_event, stop_event, []})

# 4. Return a response, which will invoke the event handler
# for the stop event.
Plug.Conn.send_resp(conn, 200, "OK")
We have successfully attached one handler to each of the events triggered by
Plug.Telemetry, in this case [:user, :invitation, :start] and
[:user, :invitation, :stop], and called the two handlers by calling
Plug.Telemetry and returning the response from %Plug.Conn{}.
I think it's worth pointing out that this code should only serve as an example to how all of this works, you probably don't want to directly call plugs in Production, but it's a good exercise to understand how things work under the hood.
Phoenix.Logger
We’re close to seeing the full picture, but we first need to look into
Phoenix.Logger. This module leverages the :telemetry.attach/4 function to
attach some of its public functions to specific events. In the context of
this blog post, we only care about the [:phoenix, :endpoint, :start] and
[:phoenix, :endpoint, :stop] events, which are handled by
Phoenix.Logger.phoenix_endpoint_start/4 and
Phoenix.Logger.phoenix_endpoint_stop/4, respectively.
If you look at those functions you can see that, unless log_level/2 returns
false, then the function will log information about the connection:
phoenix_endpoint_start/4will log what’s the HTTP method and the request path for the connection. For example:
[info] GET /
phoenix_endpoint_stop/4will log information about the connection type, the HTTP status of the response and how long it took to process the connection
[info] Sent 200 in 40ms
These are the two functions that, by default, are always run when a new request reaches a Phoenix app, as well as when a response is returned.
Putting it all together
Now that we know how each piece works individually you must be wondering how
this all comes together.
You see, when you create a new Phoenix app, Phoenix will generate a lot of
modules for you, and one of these modules is the endpoint module. Assuming
your app is named Mirage , this module would be named MirageWeb.Endpoint.
If you take a look at the endpoint module generated by Phoenix you’ll see that, by default, it uses one of the plugs mentioned befored:
defmodule MirageWeb.Endpoint
  use Phoenix.Endpoint, otp_app: :mirage

  ...

  plug Plug.Telemetry, event_prefix: [:phoenix, :endpoint]

  ...
end
There it is, our familiar friend, Plug.Telemetry, using an event prefix
we’ve seen before – [:phoenix, :endpoint].
We now understand that, whenever request reaches a Phoenix app, it’ll first go
through the endpoint module, where Plug.Telemetry will be called with the
:event_prefix option set to [:phoenix, :endpoint].
In turn, this will trigger a call to
:telemetry.execute, emitting the [:phoenix, :endpoint, :start] event,
which invokes the handler
function that logs the request’s method and path –
Phoenix.Logger.phoenix_endpoint_start/4 – as well as calling
Plug.Conn.register_before_send/2, registering another call to
:telemetry.execute, this time around emitting the
[:phoenix, :endpoint, :stop] event.
When this last function is called by
Plug.Conn before the response is sent, the stop event will be emited and
Phoenix.Logger.phoenix_endpoint_stop/4 will be called.
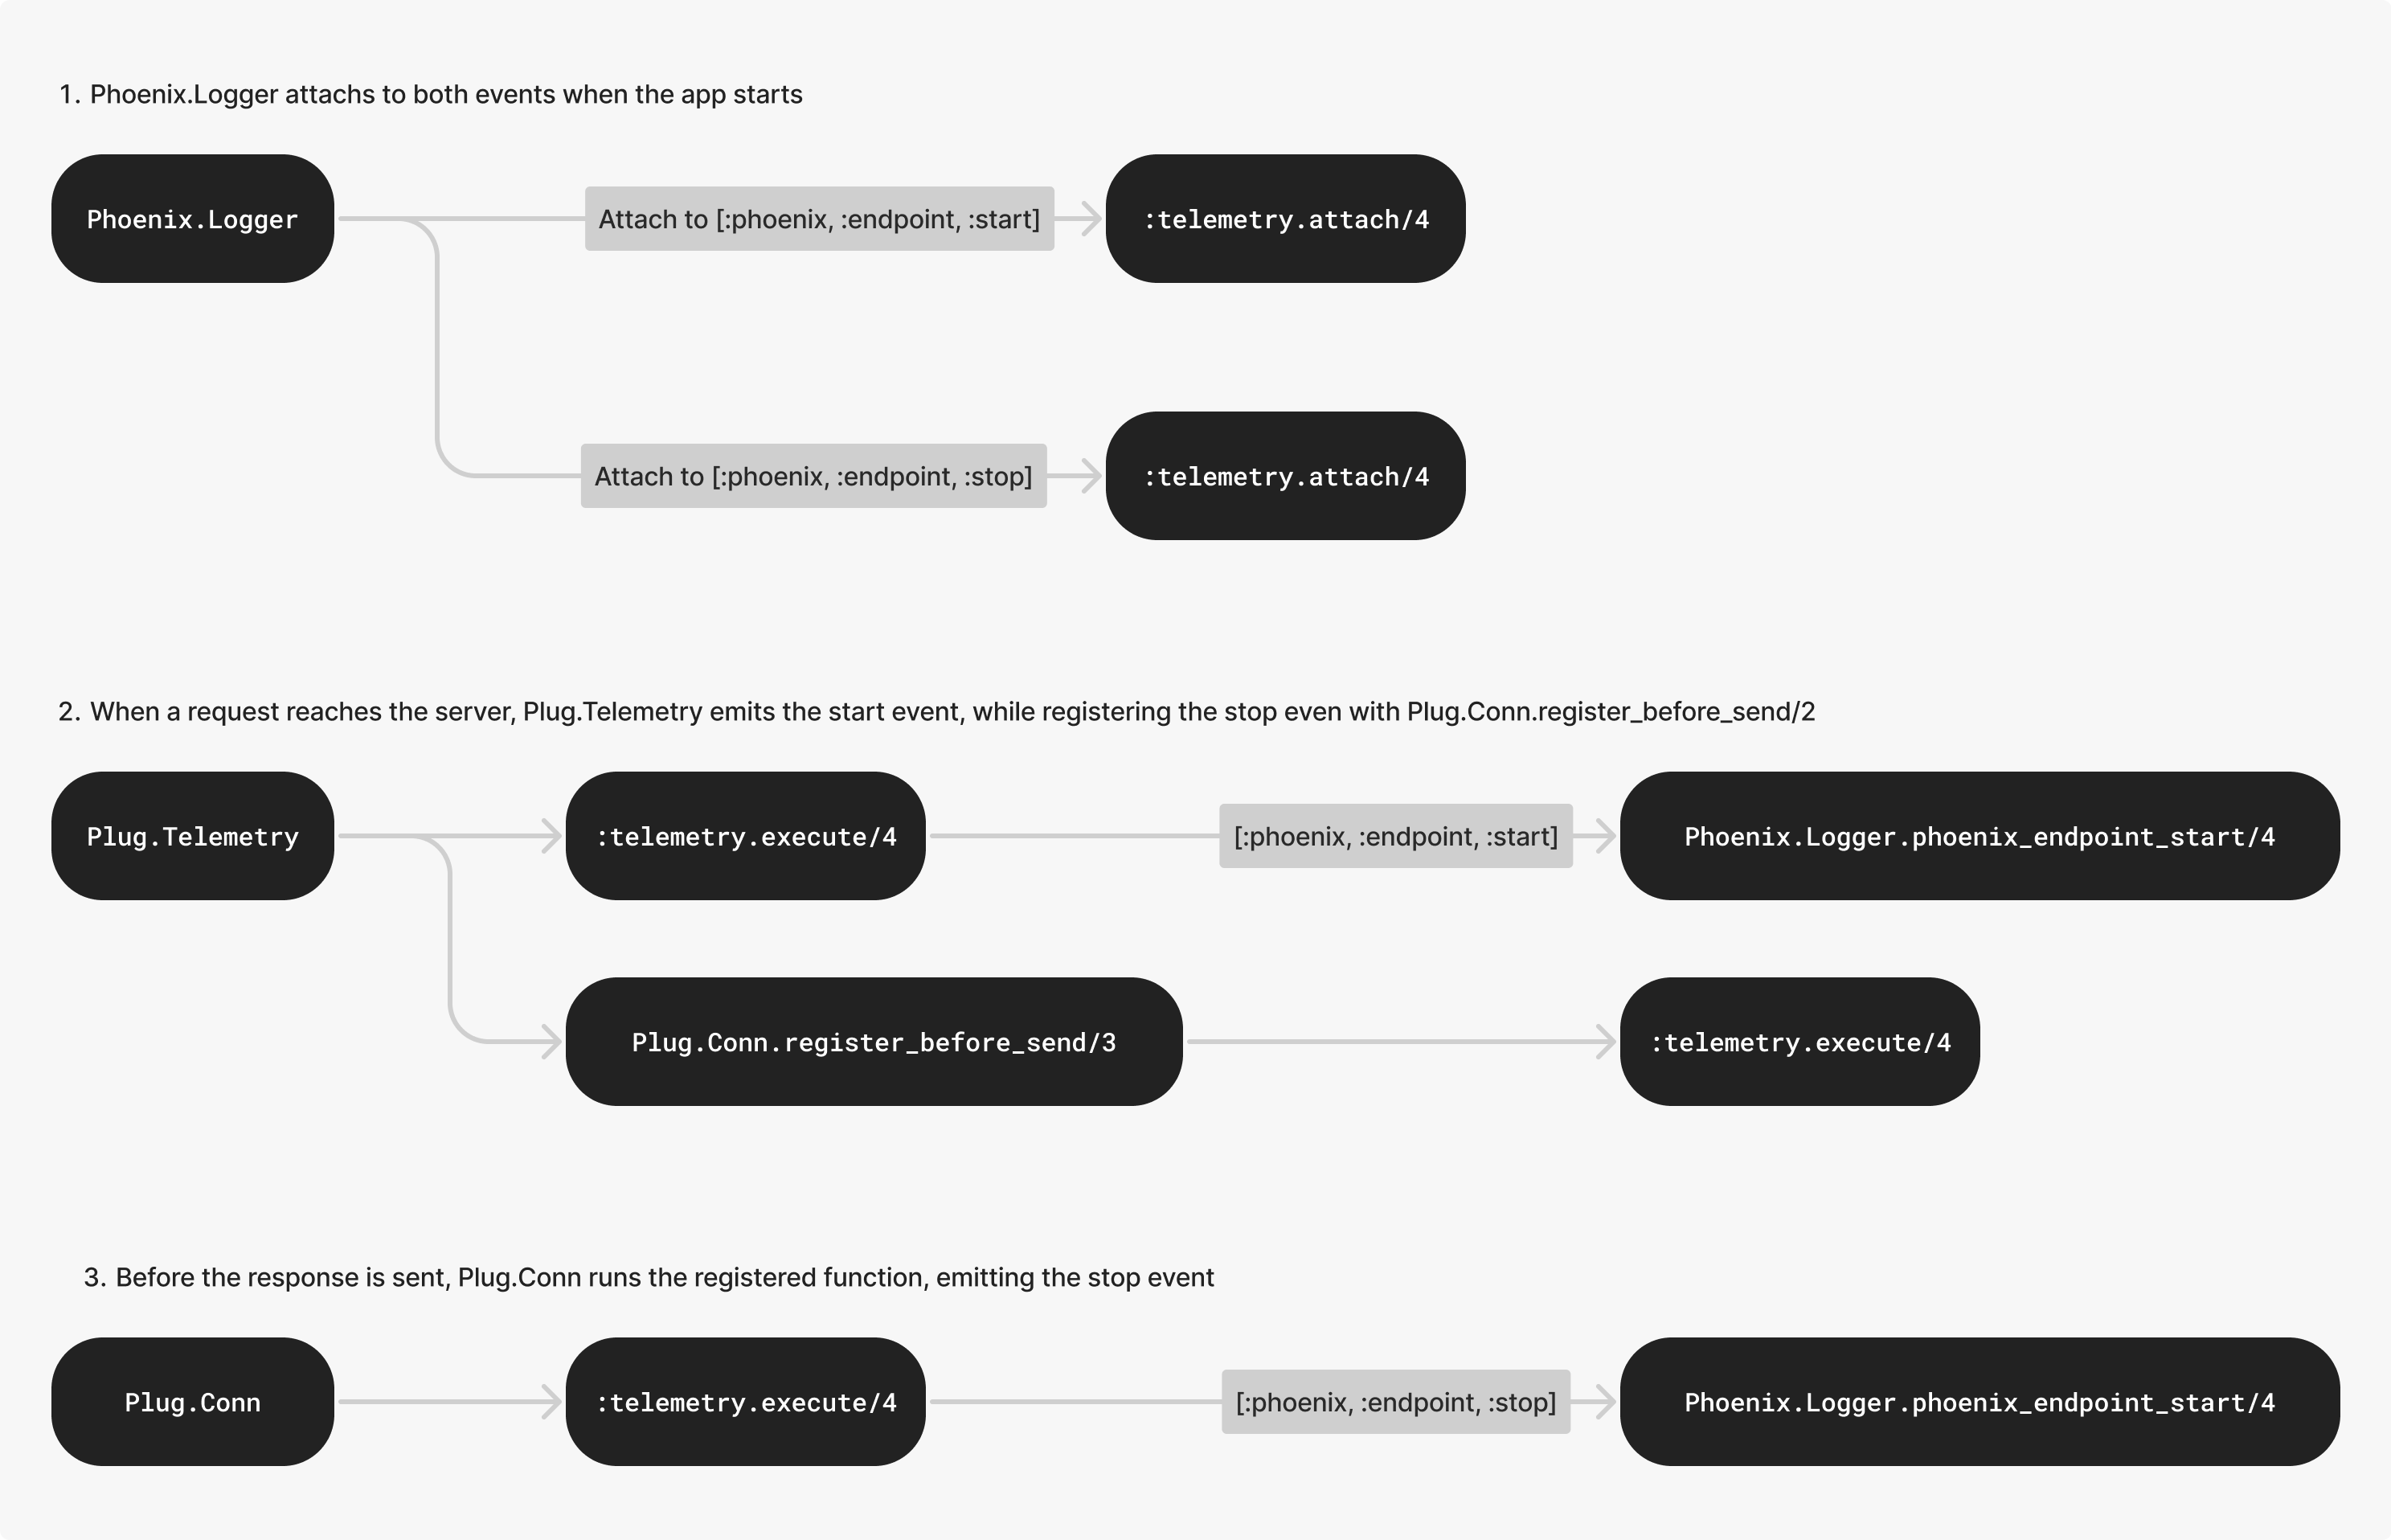
There might be more nuances in the middle of all of this process, but this gives you a nice overview on how all of this happens.
Here's a diagram, summing all of this up, to help visualize the flow of events:
Conclusion
In this exploration of the Phoenix framework, we've uncovered how it logs information about the requests and responses that reaches its endpoints. It was an interesting exploration learning how all of these different pieces come together to achieve something as simple as logging these messages.
Even better is knowing how easy it is to leverage the :telemetry package in
order to attach handler functions to specific events, all the other modules end
up building on top of this, and it's something I'm already using on some
personal projects now that I'm more familiar with how it works.